AWS Developer Tools Blog
Enabling Metrics with the AWS SDK for Java
Ever thought about generating metrics that measure your application’s performance on accessing AWS, and then having those metrics uploaded to Amazon CloudWatch for visualization or monitoring purposes ? How about generating performance metrics of your JVM’s when used against AWS ? Wouldn’t it be nice to capture and visualize metrics related to the runtime environment such as the heap memory, number of threads, and opened file descriptors all in one place ?
We are excited to announce a new feature in the AWS SDK for Java that can do exactly that – automatic metric generation, collection, and uploads to CloudWatch.
This feature is disabled by default. To enable it, simply include a system property pointing to your AWS security credential file when starting up the JVM. For example:
-Dcom.amazonaws.sdk.enableDefaultMetrics=credentialFile=/path/aws.properties
And you are all set!
“But,” you may ask, “why do I need to specify a credential file ?” Great question! Under the hood, the default SDK metrics collection needs the necessary AWS security credentials to access Amazon CloudWatch. That’s what the
credentialFile attribute is for. On the other hand, if you are accessing AWS via the more secure and recommended option of
Instance profile credentials through the Amazon EC2 instance metadata service, you don’t even need to specify the credential file. In other words, to enable metrics, you need only specify:
-Dcom.amazonaws.sdk.enableDefaultMetrics
Once you enable this feature, every time there is a service request to AWS via the SDK for Java, metric data points will get generated, queued for statistical summary, and then uploaded asynchronously to Amazon CloudWatch about once every minute. The default set of metrics is divided into three major categories:
AWS Request Metrics,
AWS Service Metrics, and
Machine Metrics. AWS Request Metrics covers areas such as the latency of the HTTP request/response, number of requests, exceptions, and retries. Examples of AWS Service Metrics include the throughput and byte count metrics for S3 uploads and downloads. Machine Metrics, on the other hand, covers the runtime environment including heap memory, number of threads, and open file descriptors. Even though there is little reason to exclude Machine Metrics, you can do so by including
excludeMachineMetrics in the very same system property, like so:
      -Dcom.amazonaws.sdk.enableDefaultMetrics=
        credentialFile=/path/aws.properties,excludeMachineMetrics
(All in a single line with no space.)
Once you’ve uploaded metrics to Amazon CloudWatch, not only can you visualize them in the AWS Management Console, you can also set alarms on potential problems like memory leakage, file descriptor leakage, and so on. All metrics captured by the SDK for Java are under the namespace
AWSSDK/Java, and by default are uploaded to the Amazon CloudWatch default region
us-east-1. If you want to change the region, simply specify the value for the
cloudwatchRegion attribute in the system property. For example, the following line overrides the Amazon CloudWatch region for metric uploads to
us-west-2:
      -Dcom.amazonaws.sdk.enableDefaultMetrics=
        credentialFile=/path/aws.properties,cloudwatchRegion=us-west-2
(All in a single line with no space.)
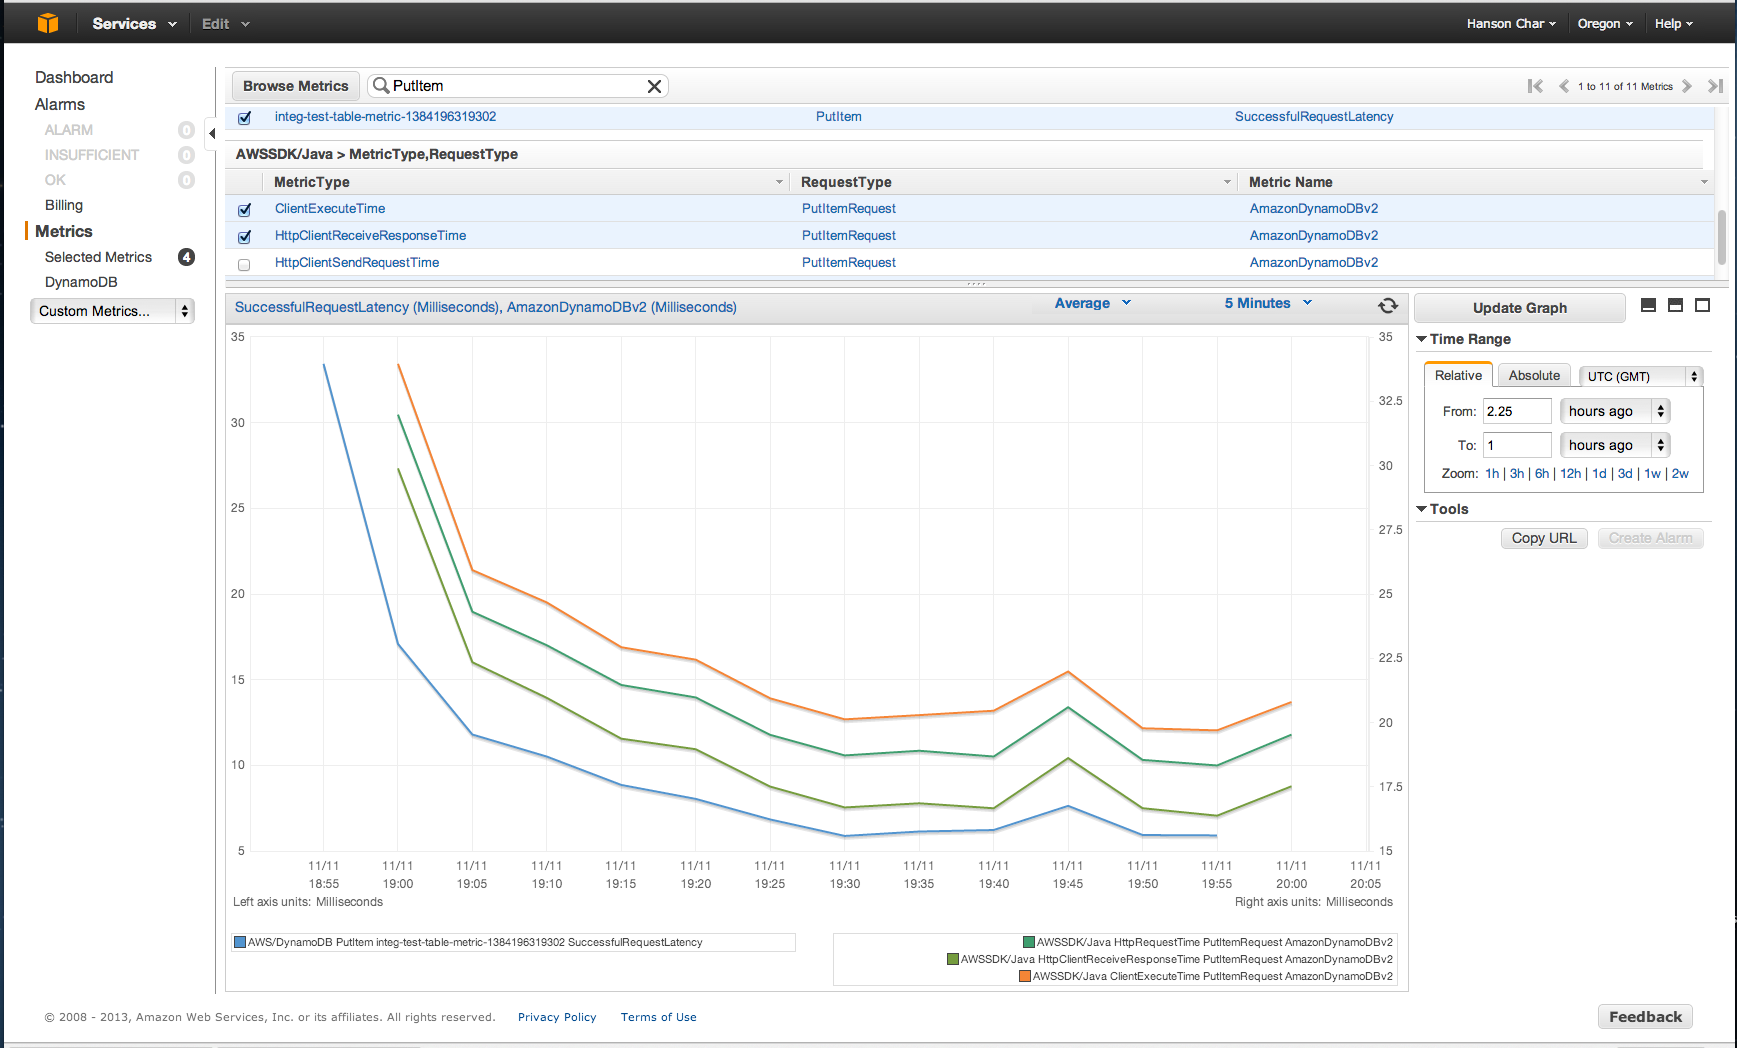
Following are some sample screen shots of what the metrics would look like in the AWS Management Console.
Request Metrics showing the client-side HTTP response time (
HttpClientReceiveResponseTime) vs. client-side total request execution time (
ClientExecuteTime) of writing to Amazon DynamoDB with
PutItemRequest:
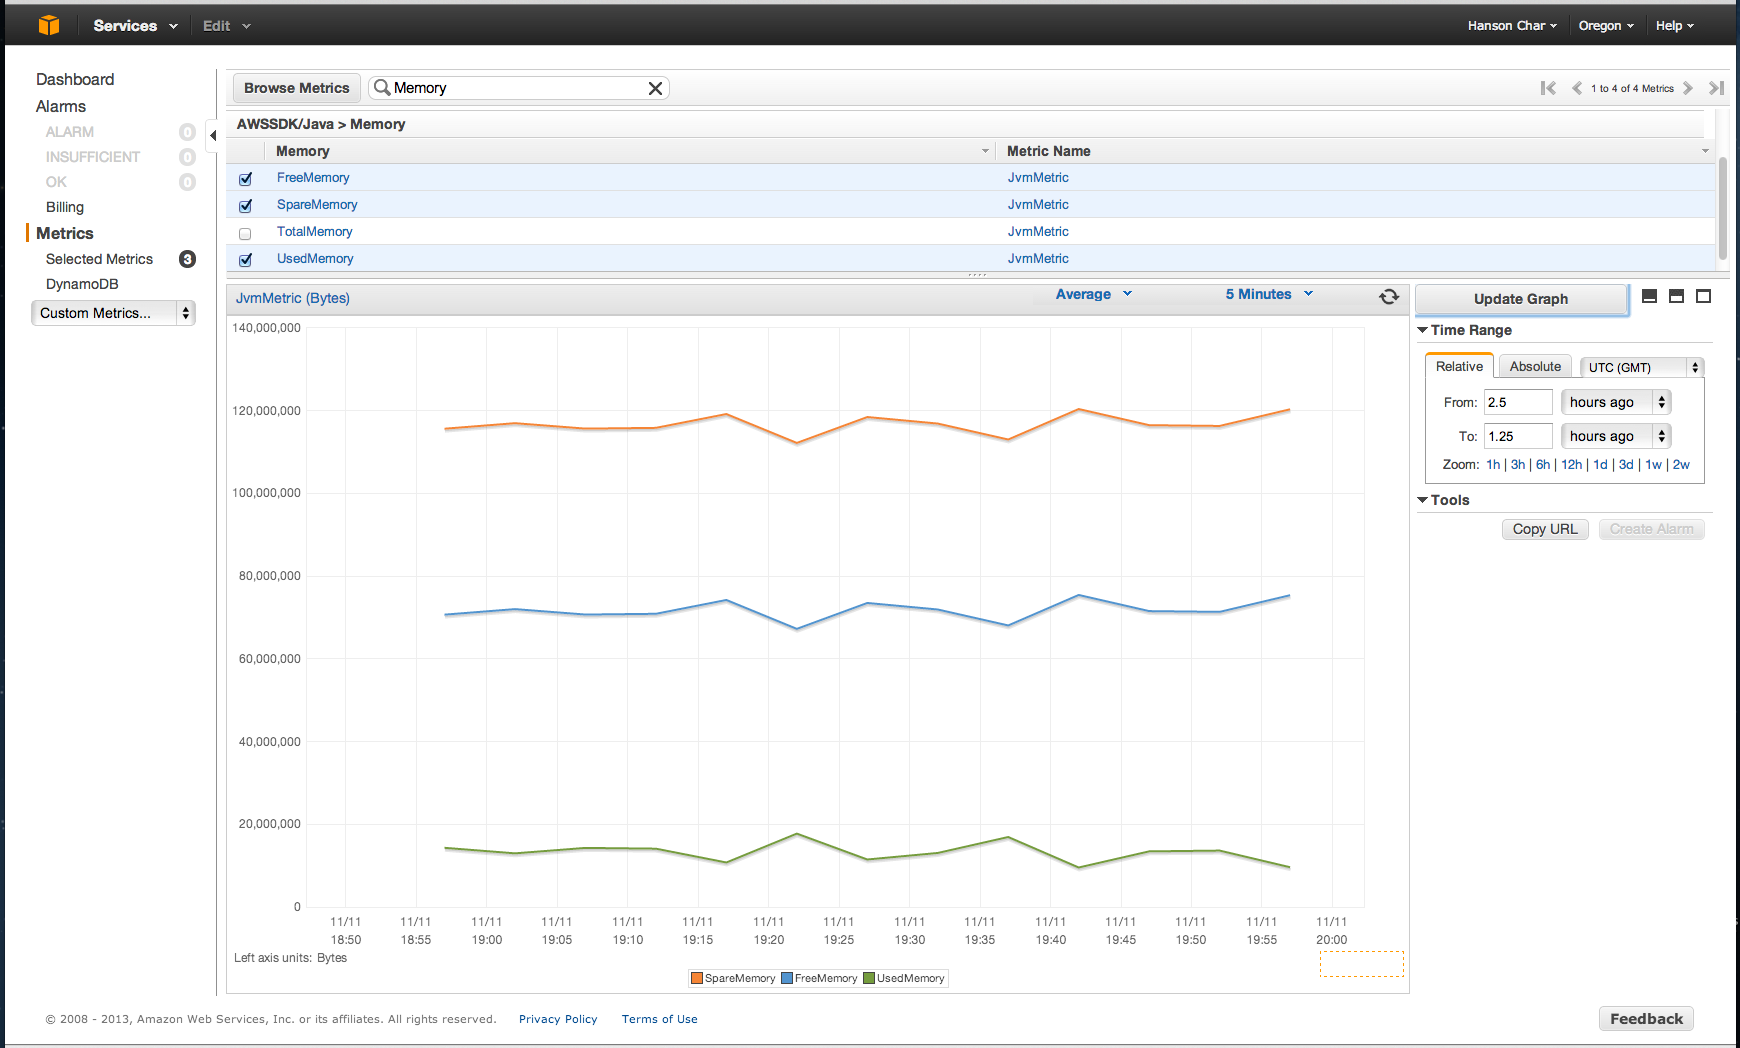
Machine Metrics sample screenshot, showing the JVM’s heap memory while making those AWS requests:
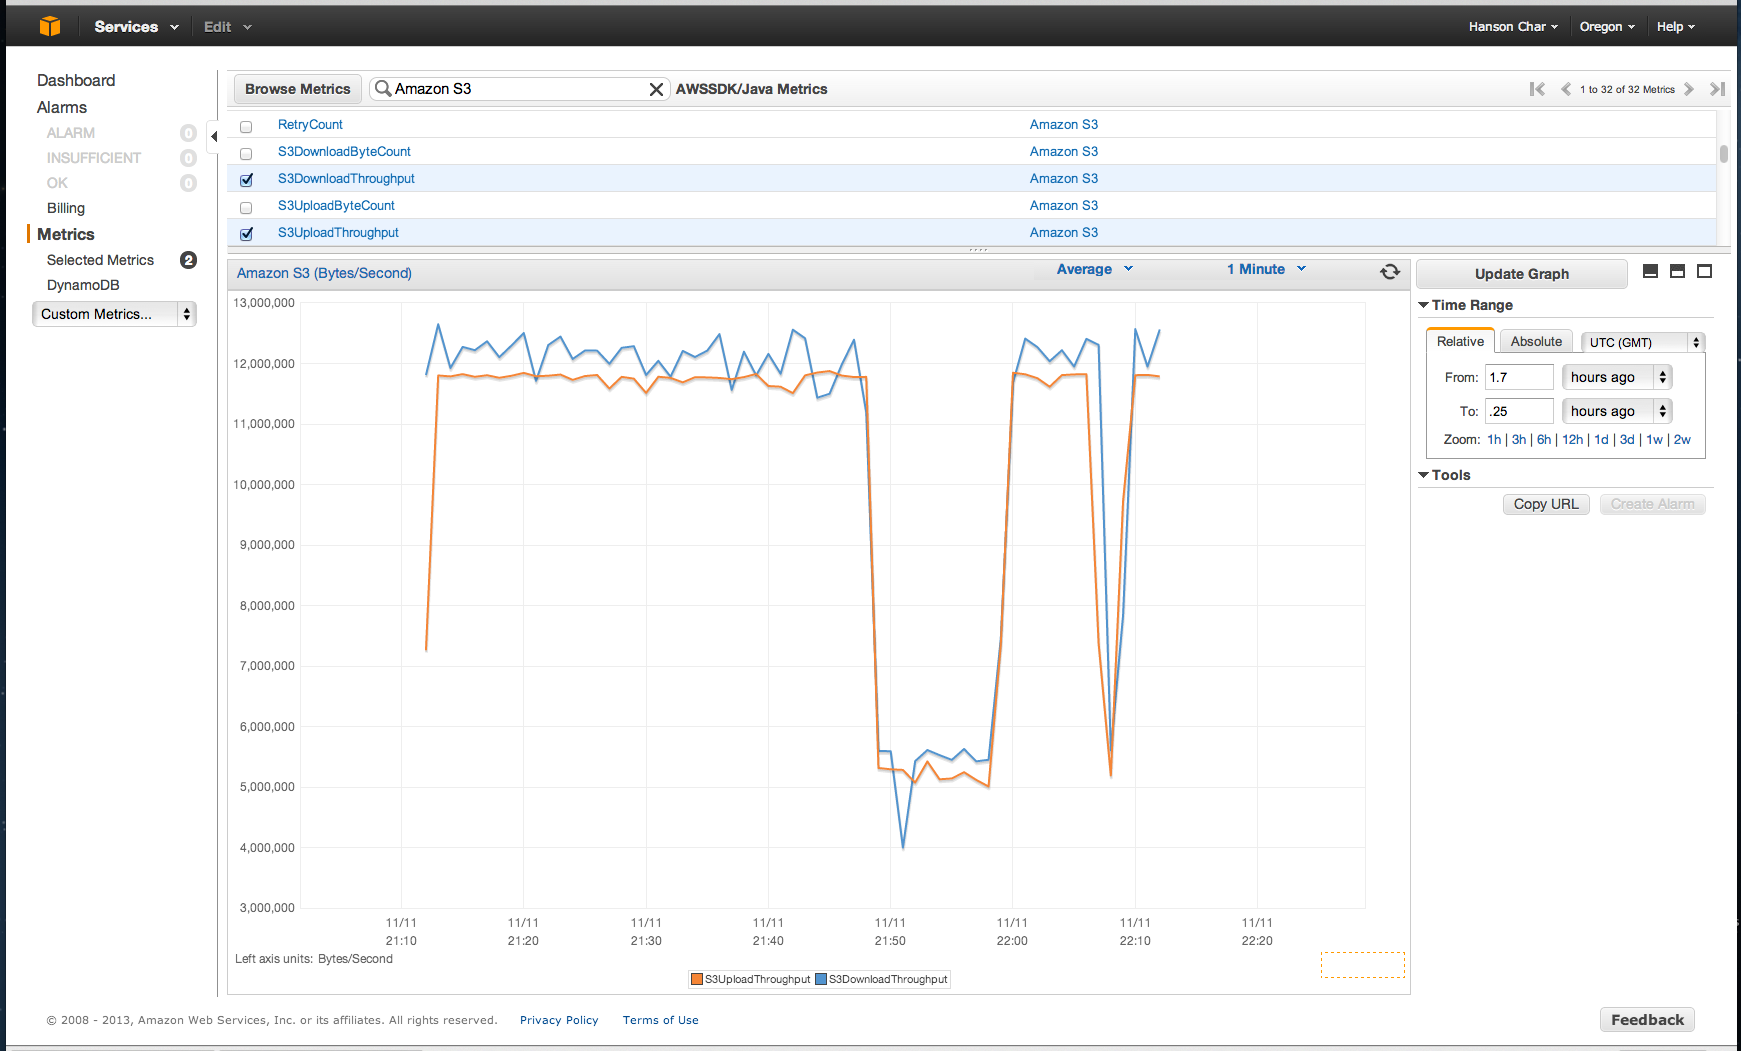
Service Metrics sample screenshot, showing the S3 download and upload throughput (byte/second):
Please see the
package summary for a full list of the predefined core metric types. Additional features, such as the dynamic control of the metrics system via JMX, will likely take up more blog space than we have here. If you can’t wait, however, just fire up jconsole and look for MBeans under the namespace
com.amazonaws.management. Let us know what you think!